Background
This project was a part of different projects in the course ENPM673: Perception for Autonomous Robots at the University of Maryland. The code for this project is written in python using OpenCV and can be found at my Github repo here
Introduction
The project aims to detect lanes using simple (and complex) computer vision algorithms. Though you might be excited to see machine learning here, but to be honest we don’t need a machine-learning algorithm to solve this problem. You will see that how using simple algorithms would help us to detect lanes in an image. This image processing pipeline can be scalable to support live video feed.
Lane detection is used in self-driving cars for lane departure warnings. But here we won’t go in detail about ins and outs of a self-driving car.
Let’s take an image just as below which has a clear view of lanes.
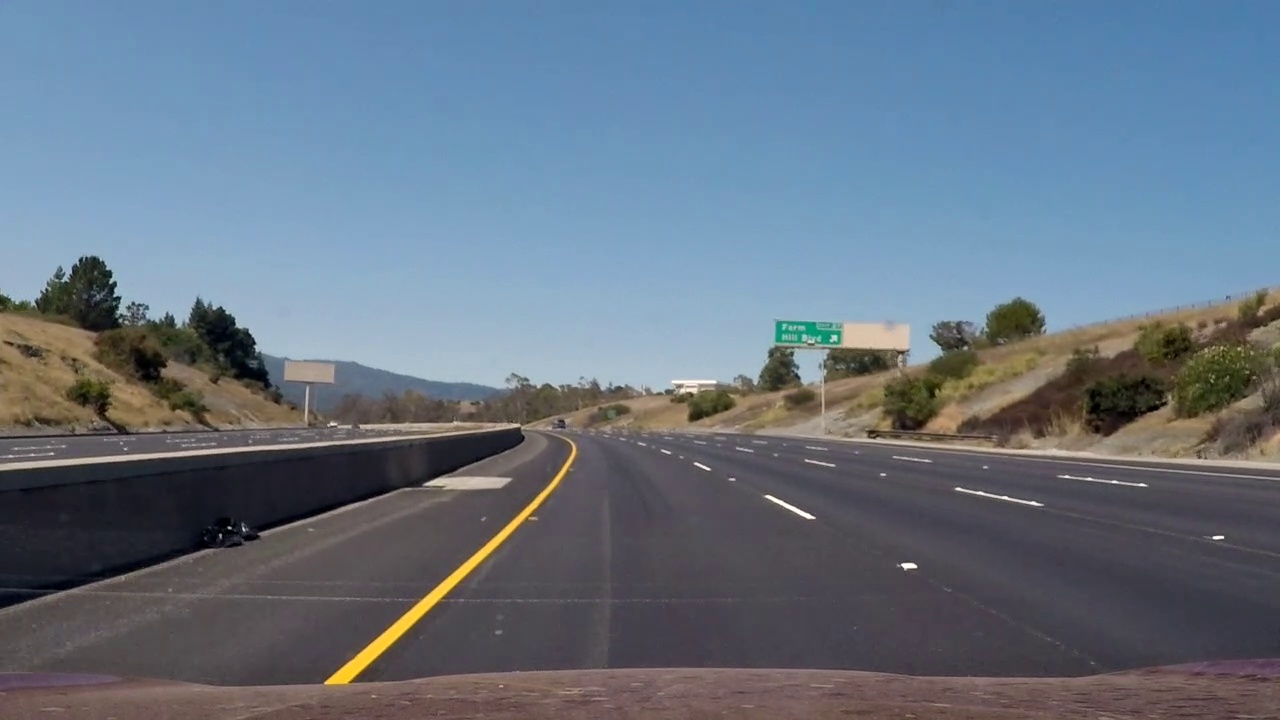
Image cleaning and Dimension reduction (Image Denoising)
We convert the color image to greyscale image because color information is irrelevant to us and after that, we would apply Gaussian smoothing or filtering this would help reduce the noise in our image. Below code, snippet demonstrates this operation in python.
# Importing necessary libraries
import cv2
import numpy

# This method handles all the preprocessing stuff for us
def image_preprocessing(frame):
    # Converting color image to grayscale image
    image = cv2.cvtColor(frame, cv2.COLOR_BGR2GRAY)
    # Applying gaussian blur to out image of kernel size 5X5
    image = cv2.GaussianBlur(image, (5, 5), 0)
    return image

def main():
    # Reads image
    # Replace the args with you image path
    image = cv2.imread("path/to/your/image.jpg")
    # Calling image_preprocessing method
    preprocessed_image = image_preprocessing(image)
    opencv_window_name = "Lane Detection"
    cv2.imshow(opencv_window_name, image)
    cv2.waitkey(0)
    return

if __name__ == '__main__':
    main()
    pass
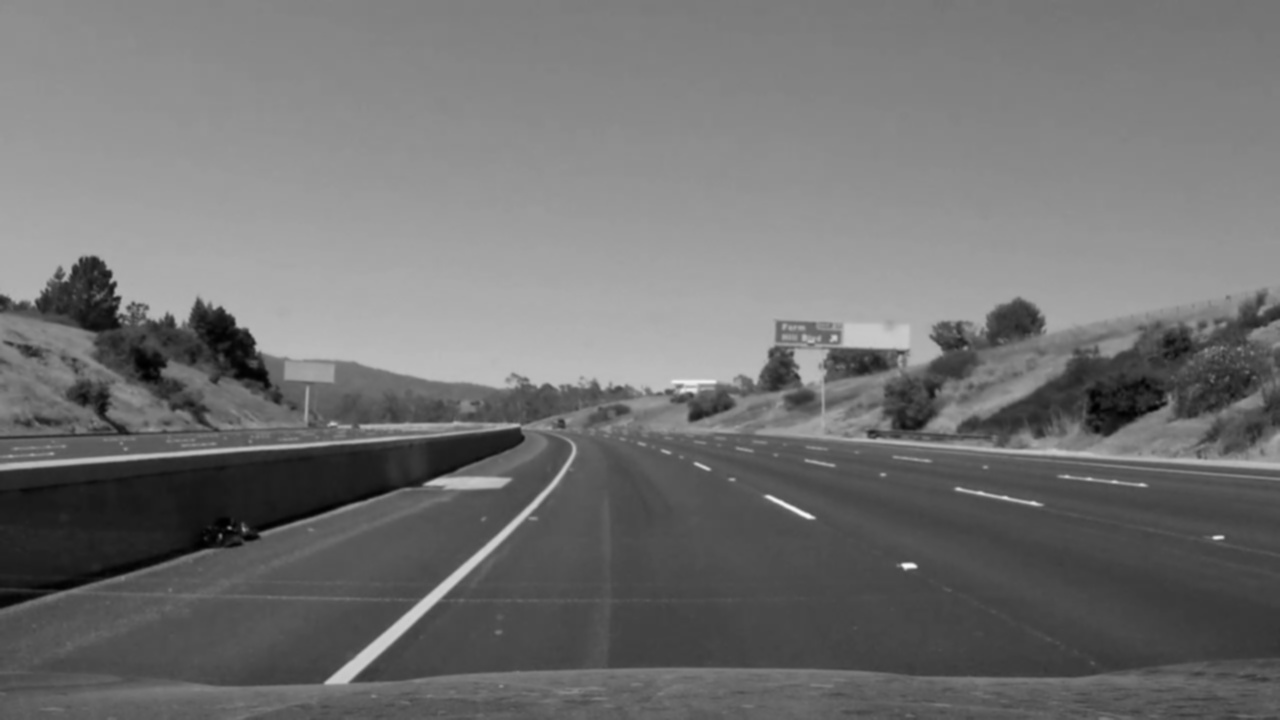
Now the preprocessed image would look something like this
Edge Detection
Now we have a perfect denoised image and for the next step, we would be detecting edges. The popular algorithm for edge detections is Canny Edge detection and Sobel Operator. We would be using a canny edge detector as it works accurately in lane detection. But please feel free to experiment by yourself.
# This method handles all the preprocessing stuff for us
def image_preprocessing(frame):
    # Converting color image to grayscale image
    image = cv2.cvtColor(frame, cv2.COLOR_BGR2GRAY)
    # Applying gaussian blur to out image of kernel size 5X5
    image = cv2.GaussianBlur(image, (5, 5), 0)
    # Applying canny edge detection
    # First argument converts the image to unsigned int
    # Second and third arg handles thresholding (Hysteriesis Thresholding https://docs.opencv.org/trunk/da/d22/tutorial_py_canny.html)
    image = cv2.Canny(numpy.uint8(image), 100, 255)
    return image
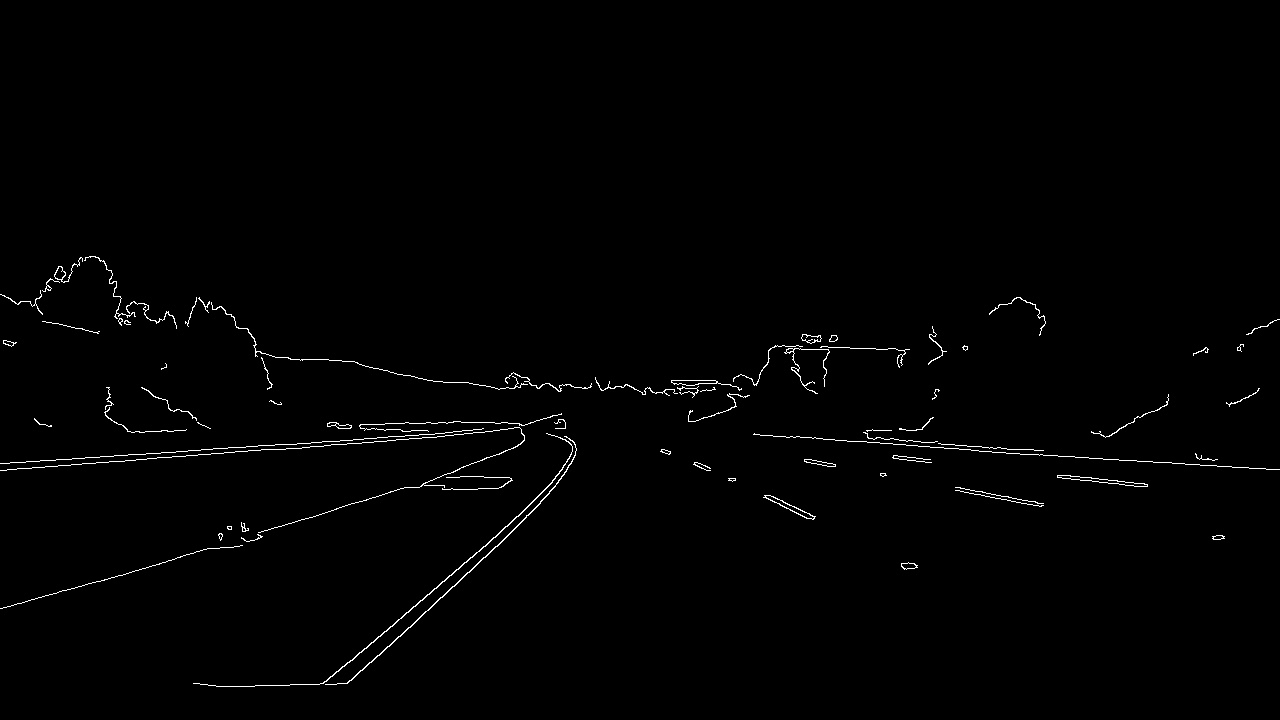
After applying Canny edge dection algorithm our image would look something like this
Extracting ROI (Region of Interest)
One question that you might have is why? Why do we want to extract a region of interest? The reason is simple - to focus on what’s important. For this objective (lane detection), which data would be important? Most important data or information is the lane itself.
Extracting ROI, which is the lane, would help us to further reduce noise in our image. TO extract the region, first we need the points from the image from which we can construct a polygon. After constructing polygon, we use masking to mask the region which is not our ROI. This way we can extract ROI using OpenCV.
I will be using an area covered by a triangle in the image as ROI
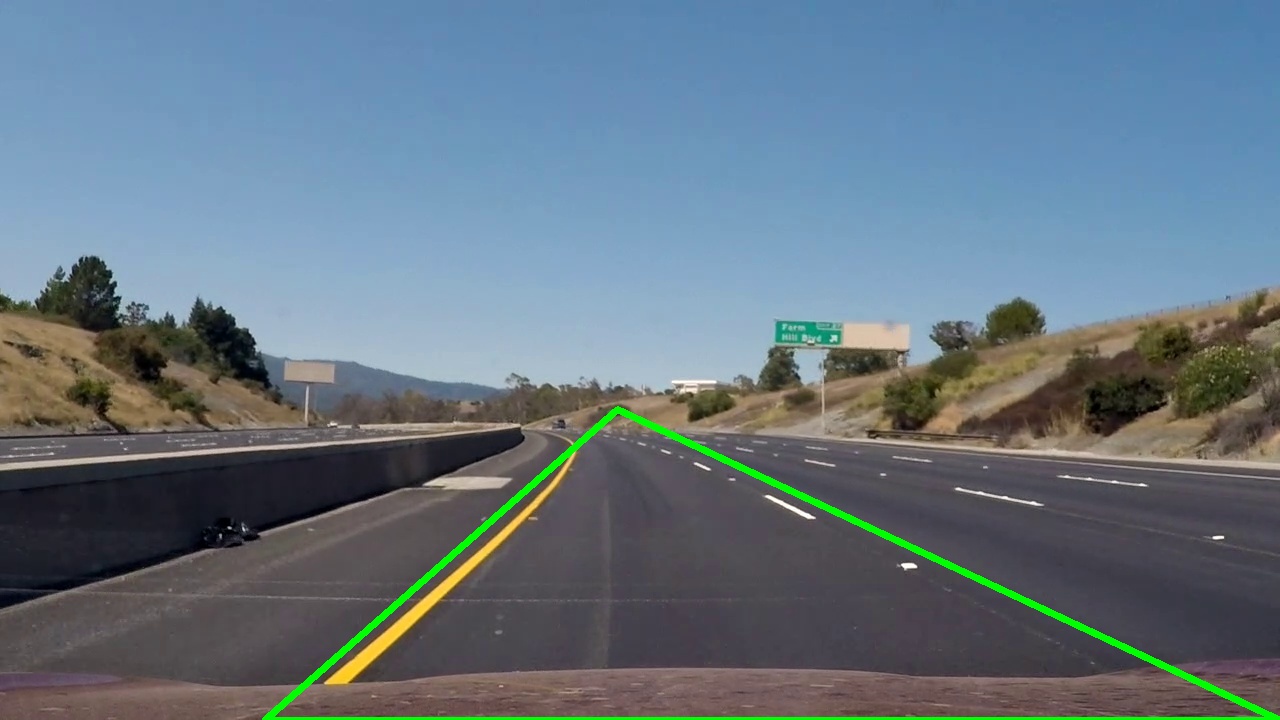
You can also choose an ROI with four sides or five sides as long as it serves your purpose.
Below code, snippet contains a function which extracts this ROI
# This method extracts ROI from variable frame of polygon points in variable polygon_points_array
def extract_roi(frame, polygon_points_array):
    # Generates black image of size same as frame
    black_mask = numpy.zeros_like(frame)
    # Filling the area under the polygon_points_array with "255"
    cv2.fillPoly(black_mask, [polygon_points_array], 255)
    # Creating another black image of size frame
    out_image = numpy.zeros_like(frame)
    # Filling those indexes of pixels which are of "255" in black_mask from frame to out_image
    out_image[black_mask == 255] = frame[black_mask == 255]
    # Returning the image
    return out_image
The returned image would look something like this
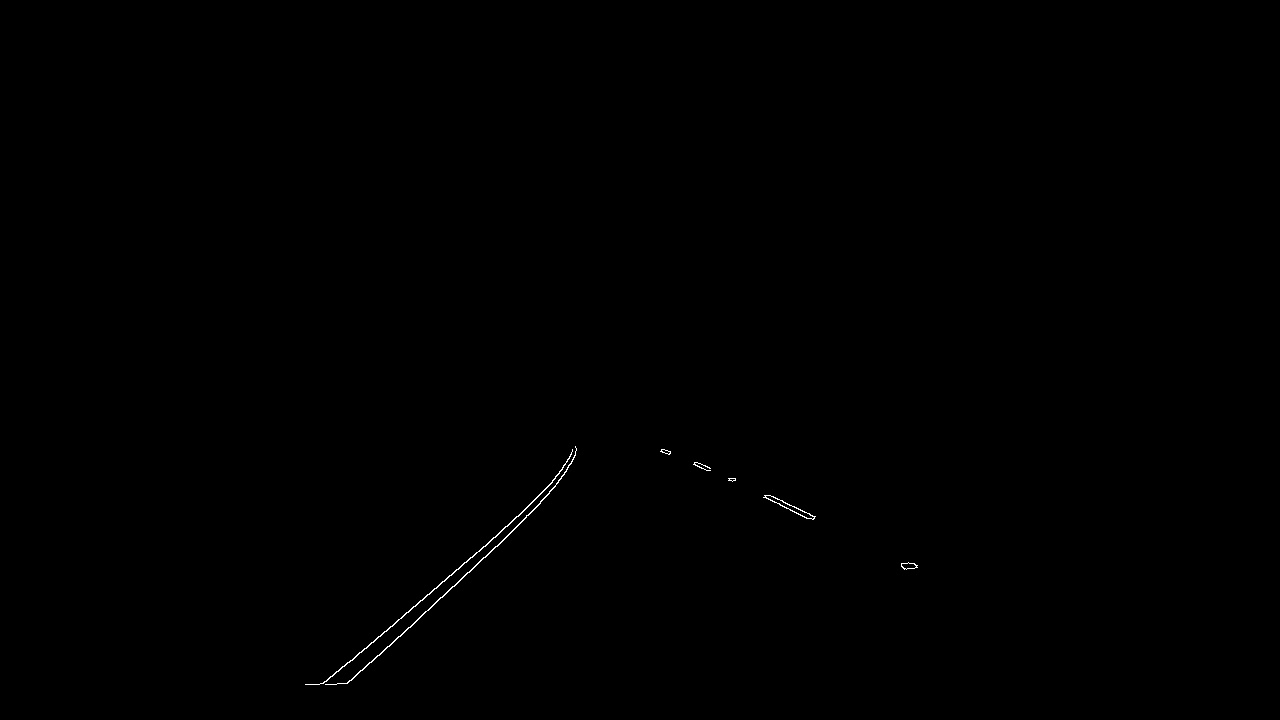
Now that we have an ROI image only thing left to do is drawing a line. For that, we first need to detect if there is a line in our image. To do that we would use the hough transform.
Hough Transform
Hough transform can detect any shape (not joking) but only if one can mathematically represent it. We will be using this technique to detect line as we can definitely it mathematically (y = mx + c or p = x cos \theta + y sin \theta).
OpenCV uses the latter representation of line and if you are curious then you can find more information on hough lines here.
Using OpenCV method cv2.HoughLinesP with args cv2.HoughLinesP(roi_image, 2, numpy.pi/180, 50, numpy.array([]), minLineLength=10, maxLineGap=5) produces these lines
cv2.HoughLinesP provided four lines but only on the left seems consistent compared to the right. To get a consistent line on both sides we need to extract their slops and find the average. The average slope will give us one line from which we can draw a line of any length.
But how would we know that the particular line is of the left lane or right lane? The answer is slope! The slope of the right lane would always be positive and the slope of the left lane would always be negative. Form this we can identify the line of the particular lane and averaging it to get a common slope.
Now with the average slope, we can construct a line of any length as from slopes and y coordinates we can examine what would be x coordinates.
Below code, snippets extract hough lines, calculates average slope and draw lines.
# This methods divides the line in two, left lane and right, lane on the basis of slope
def split_hough_lines(lines):
    left_lane_line = []
    right_lane_line = []
    for line in lines:
        for x1, y1, x2, y2 in line:
            # This method would give as slope and intercept
            params = numpy.polyfit((x1, x2), (y1, y2), 1)
            slope = params[0]
            intercept = params[1]
            if slope < 0:
                left_lane_line.append([slope, intercept])
            else:
                right_lane_line.append([slope, intercept])
            pass
        pass
    return left_lane_line, right_lane_line


# This method constructs common line from the slope and intercept
def construct_common_line(avg_line_params, image_shape):
    avg_slope = avg_line_params[0]
    avg_intercept = avg_line_params[1]
    # Max of y (end of the image in y axis)
    y1 = image_shape[0]
    # 7/10 th length from max y
    y2 = int(y1*(7/10))
    # calculating coordinates
    x1 = int((y1 - avg_intercept)/avg_slope)
    x2 = int((y2 - avg_intercept)/avg_slope)
    return [x1, y1, x2, y2]


# This method draws hough lines and calls the above two methods
def draw_hough_lines(original_image, frame):
    # Extracting lines
    lines = cv2.HoughLinesP(frame, 2, numpy.pi/180, 50,
                            numpy.array([]), minLineLength=10, maxLineGap=5)
    # Splitting the lines
    left_lane_line, right_lane_line = split_hough_lines(lines)
    left_lane_avg = numpy.average(left_lane_line, axis=0)
    right_lane_avg = numpy.average(right_lane_line, axis=0)
    left_coordinates = construct_common_line(left_lane_avg, original_image.shape)
    right_coordinates = construct_common_line(right_lane_avg, original_image.shape)
    # Drawing both the lines
    cv2.line(original_image, (left_coordinates[0], left_coordinates[1]),
             (left_coordinates[2], left_coordinates[3]), (0, 255, 0), 10)
    cv2.line(original_image, (right_coordinates[0], right_coordinates[1]),
             (right_coordinates[2], right_coordinates[3]), (0, 255, 0), 10)
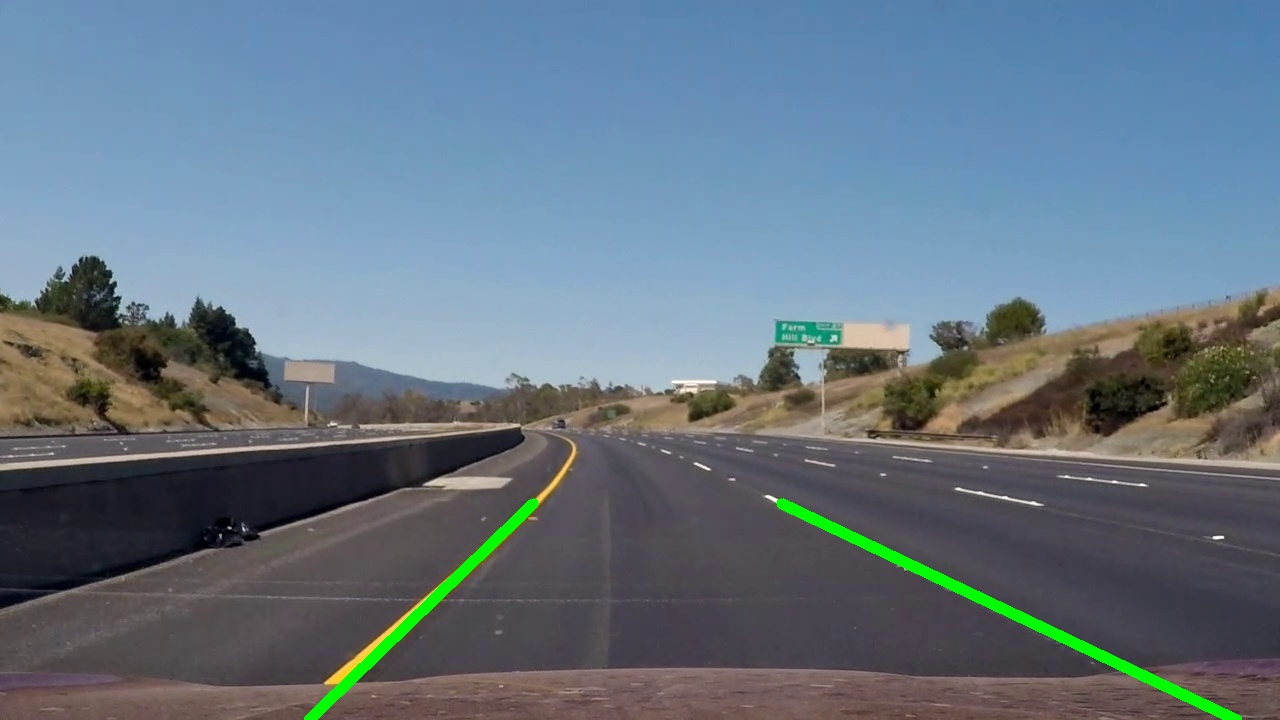
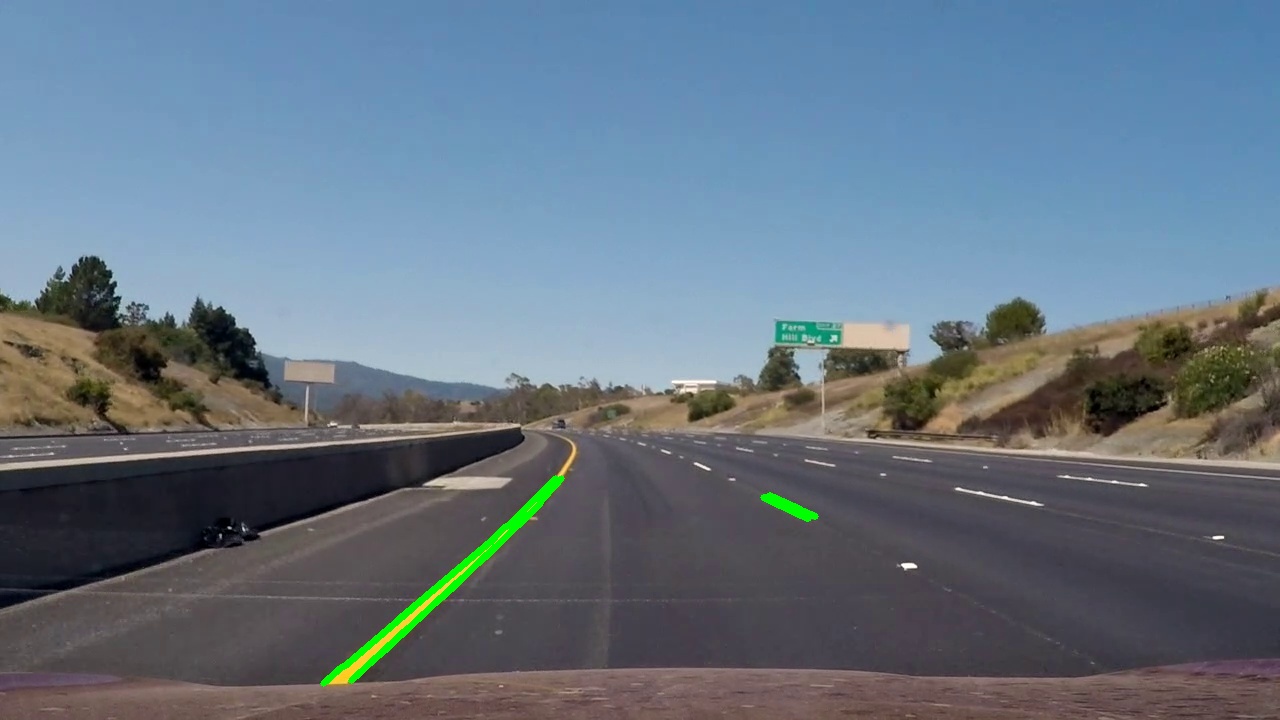
And that’s it, we successfully detected lanes. Single lane lines would look something like this
Conclusion
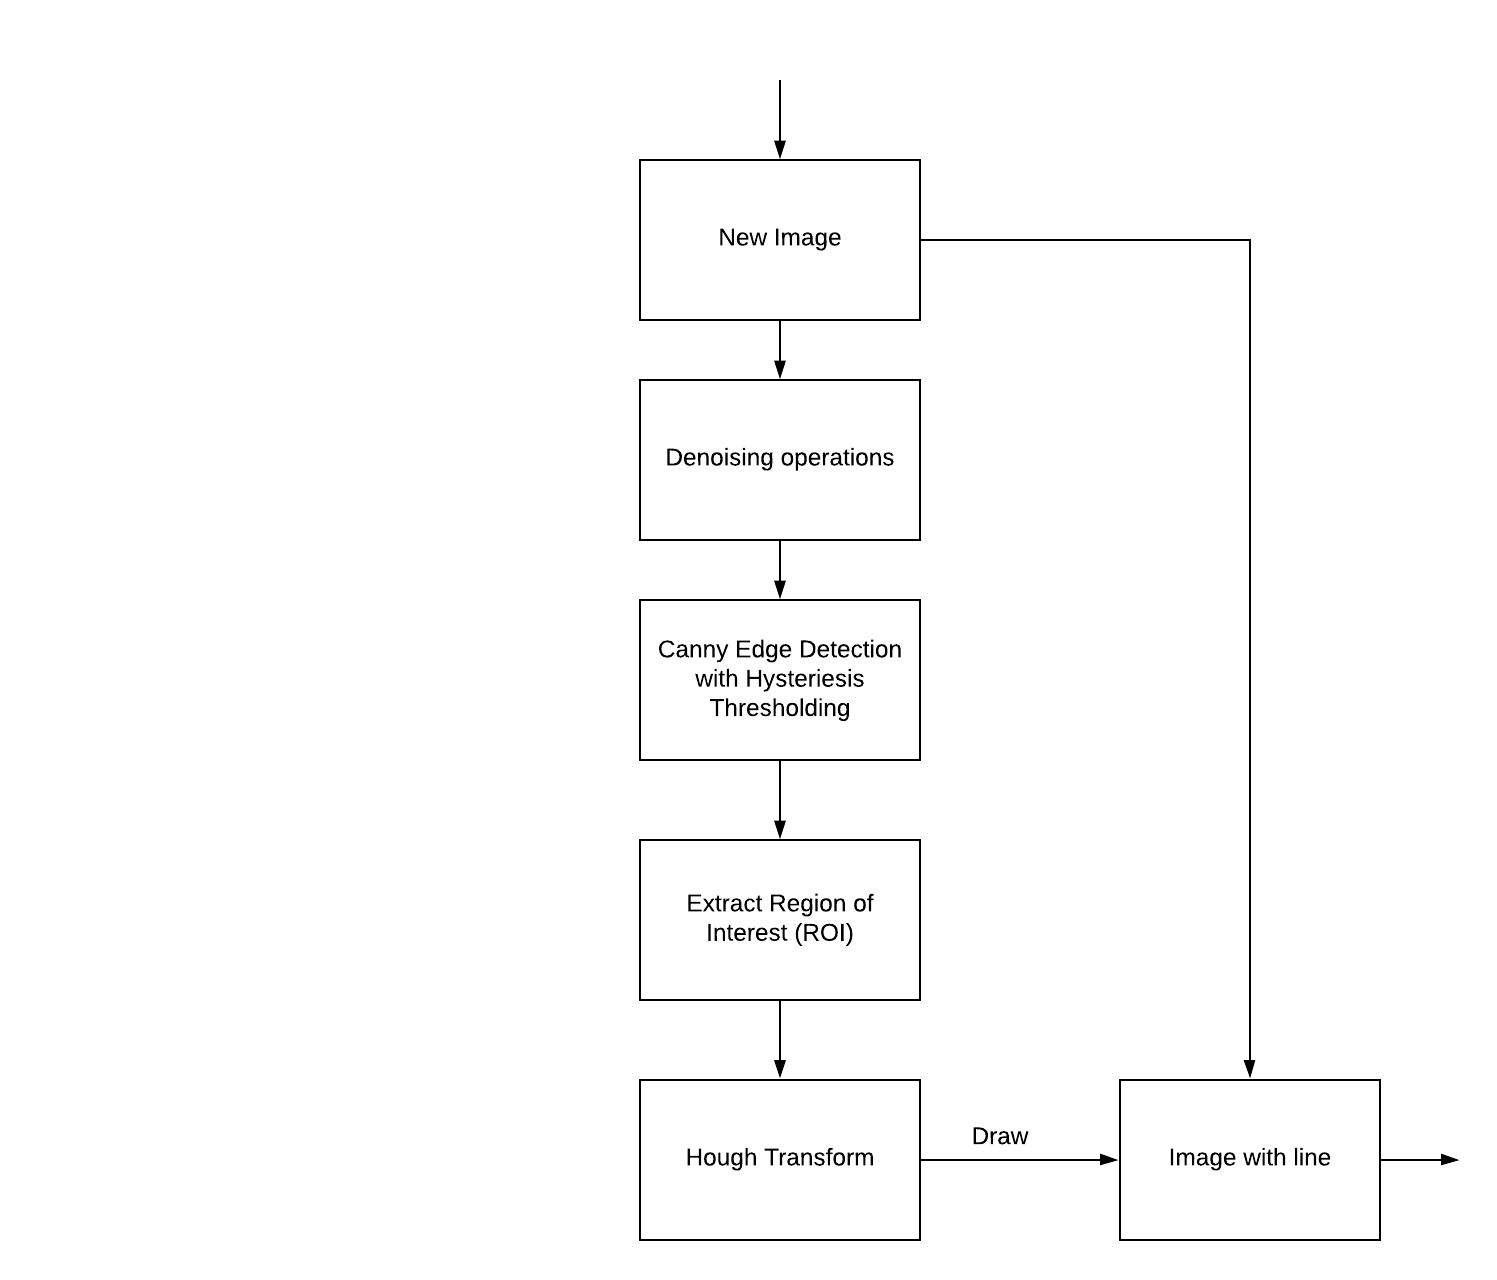
We successfully detected lane using OpenCV and python. You can use below image as reference for the pipeline that we discussed in this article.
Well, this is not the only method (or pipeline) for lane detection. You can use the color masking method which masks colors in the plane of HSV. You will need two masks one for the yellow lane and another for the white lane. Then you process the image similarly shown here. This approach would only work if there is a yellow lane on your left. But if you consider robustness, I think this pipeline would seem fit.